Skip to content
  • Home
Skins
  • Light
  • Cerulean
  • Cosmo
  • Flatly
  • Journal
  • Litera
  • Lumen
  • Lux
  • Materia
  • Minty
  • Morph
  • Pulse
  • Sandstone
  • Simplex
  • Sketchy
  • Spacelab
  • United
  • Yeti
  • Zephyr
  • Dark
  • Cyborg
  • Darkly
  • Quartz
  • Slate
  • Solar
  • Superhero
  • Vapor

  • Default (No Skin)
  • No Skin
Collapse

The Traders Room

TimaT

Tima

@Tima
administrators
About
Posts
326
Topics
206
Groups
3
Followers
3
Following
2

Posts

Recent Best Controversial

  • TTR-ADMIN
    TimaT Tima

    Silver notes from last week


    Also, please note that if 75$ level holds on the daily close and 71$ holds on the weekly close, silver will squeeze higher.


    The price has almost hit my main C&H target box.


    Dec 31st close will be important, but it will be a strong annual close anyway, see the chart below.

    Both previous 2 strong annual candle closes followed by much higher levels in the following year!

    The first big move in the early 80s was over 42%, and the second move in 2011 was 61%, so expect the Silver price to squeeze at least 50% higher early next year!


  • TTR-ADMIN
    TimaT Tima

    I see a Crypto Panic all over the place (it means the bottom is near), perfect timing for this week’s low, 4th to 7th time window, which can double bottom on the 11th of November and have a strong recovery from there into the new Moon week.

    Similar to last Year and the Year before, the first week of November always seems like a crisis…


    Similar to last year’s, November was a reversal month and the start of a big rally! The last 2 ALTSEASONs started in November!


    The end of the year is usually bullish for crypto.

    Im adding here and NOT selling!


    Crypto isn’t for everyone! It requires an epic level of patience, fearlessness, and calmness while everyone is panicking or euphoric.

    I’ve been through many ups and downs in crypto, including two bear markets. Now I see these types of moves as buying opportunities, not something that keeps me awake.


  • TTR-ADMIN
    TimaT Tima

    test es live chart


  • TTR-ADMIN
    TimaT Tima

    test - live posting


  • TTR-ADMIN
    TimaT Tima

    BTC Dominance has potentially completed its little bear flag and could begin its breakdown to its next support level - 54.50 and ultimately 50%.


    But I still think there will be no real crash in Bitcoin dominance until the end of next week is behind us


  • TTR-ADMIN
    TimaT Tima

    Net short VIX is at the highest level since 2022!

    Get ready for Sep fireworks


  • TTR-ADMIN
    TimaT Tima

    Here is an example trade with 1h timeframe chart.


    Since the price broke above yesterday’s high, the opening downtrend was weak and re-tested the gap up, or a breakout zone, which is our demand zone. Then the price has squeezed up.


    Exactly when I took a long trade! I took profits based on my extension targets and put a stop at BE on the rest. Then, closed the rest of my longs near the close of the day


  • TTR-ADMIN
    TimaT Tima

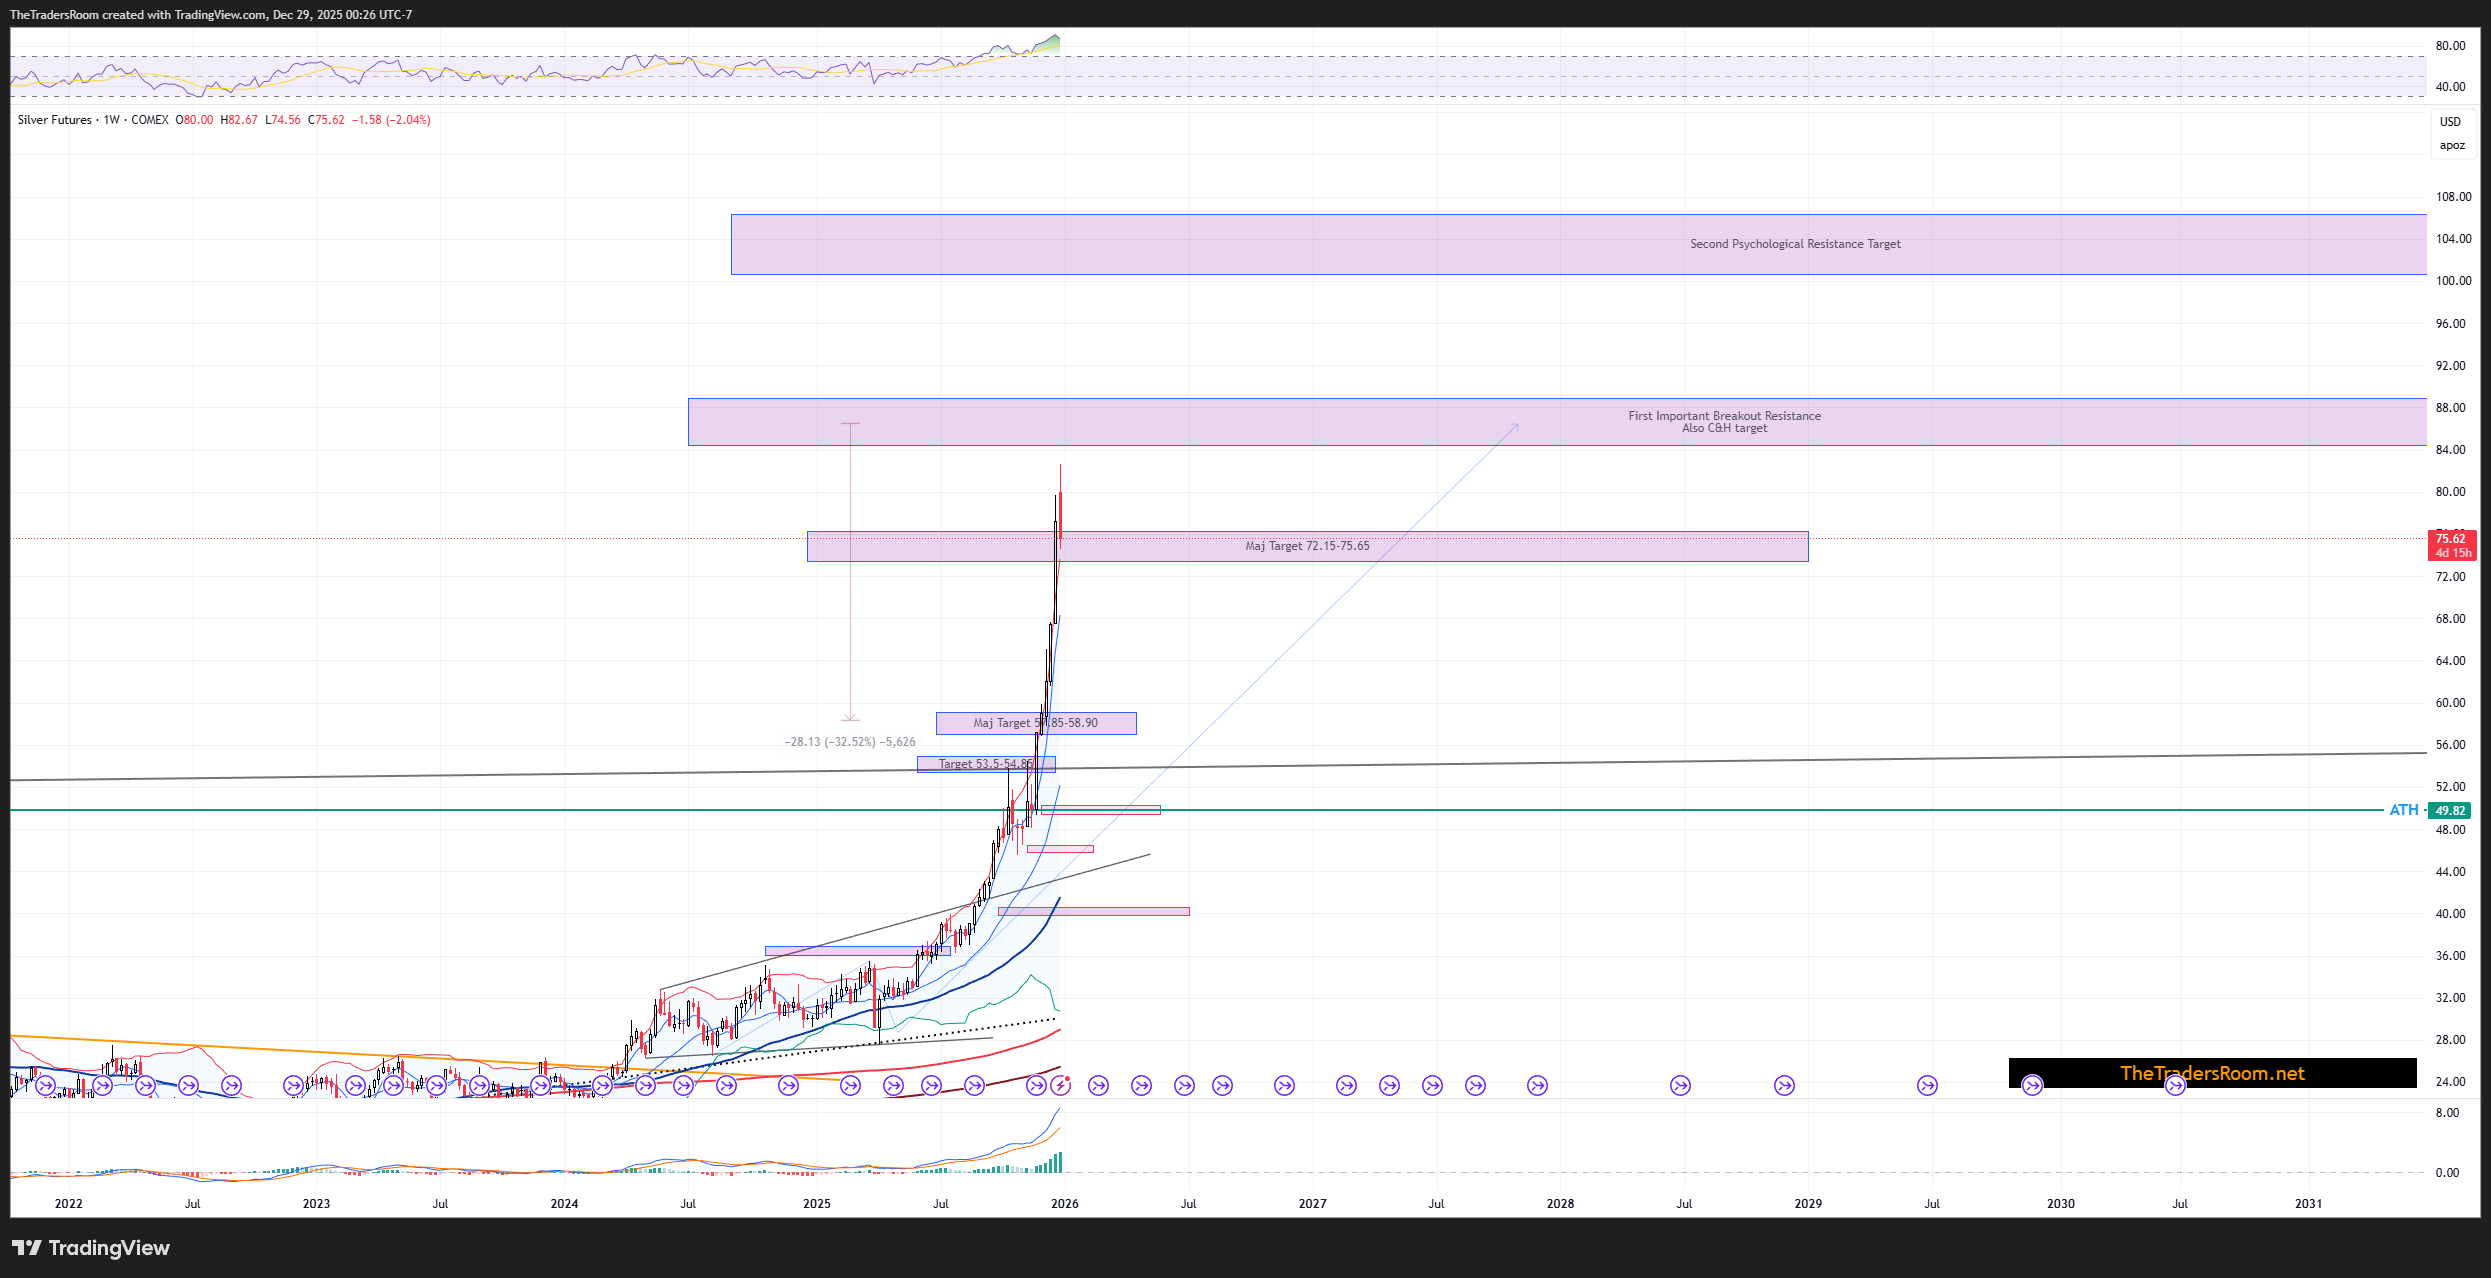
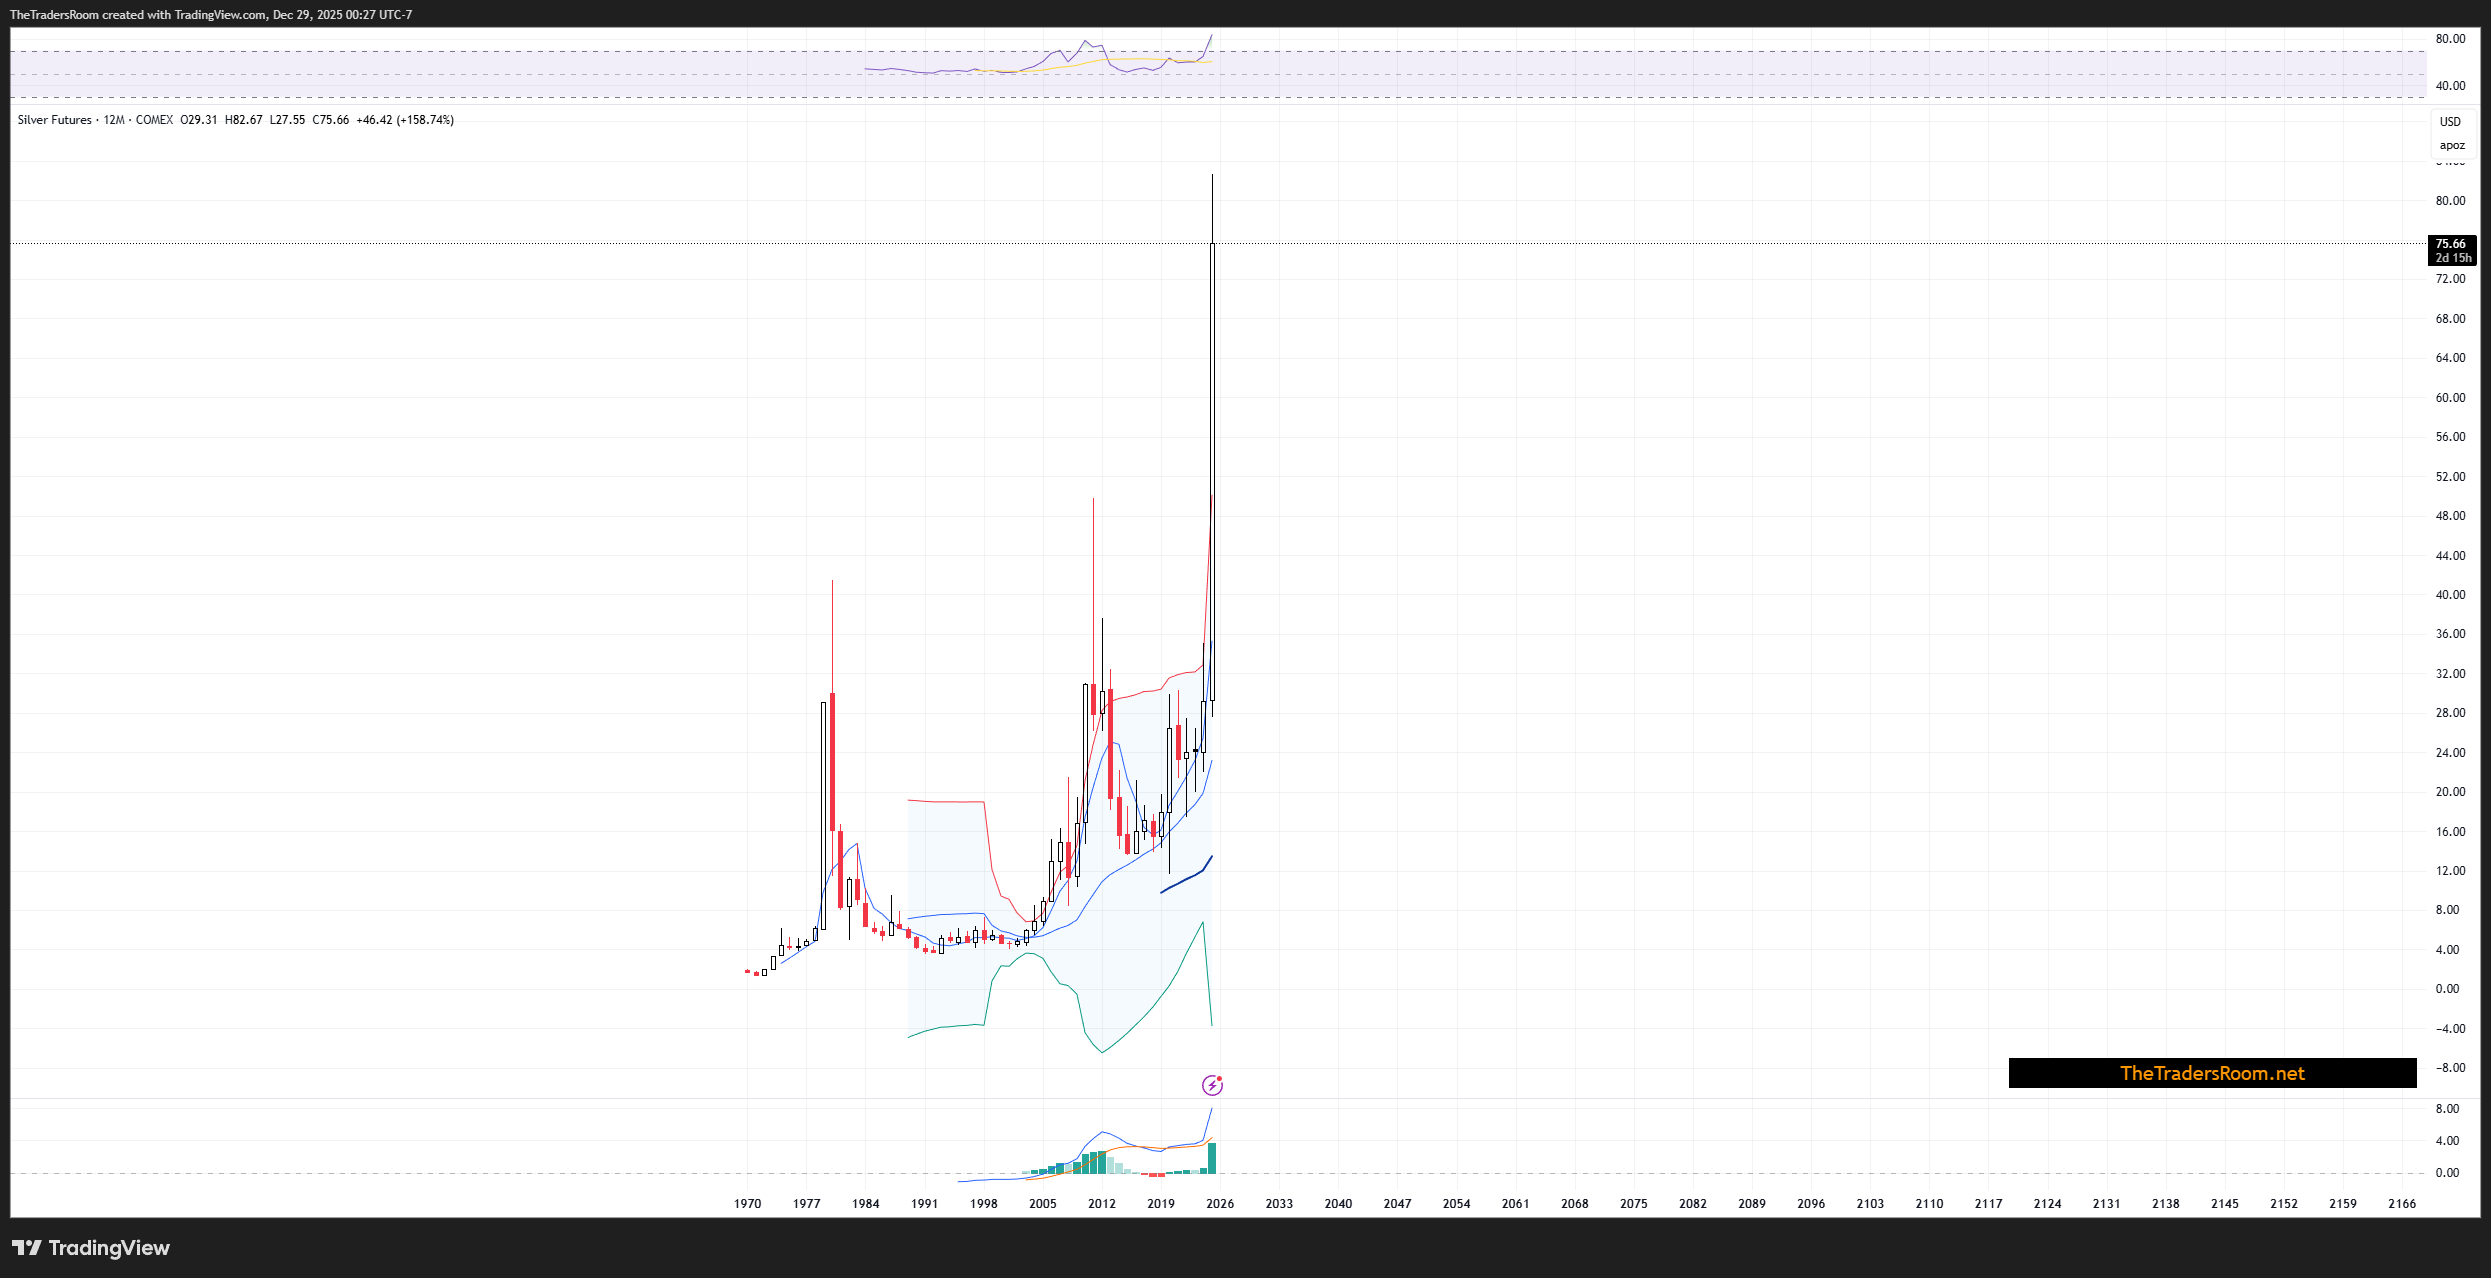
    A very high R/R trading strategy


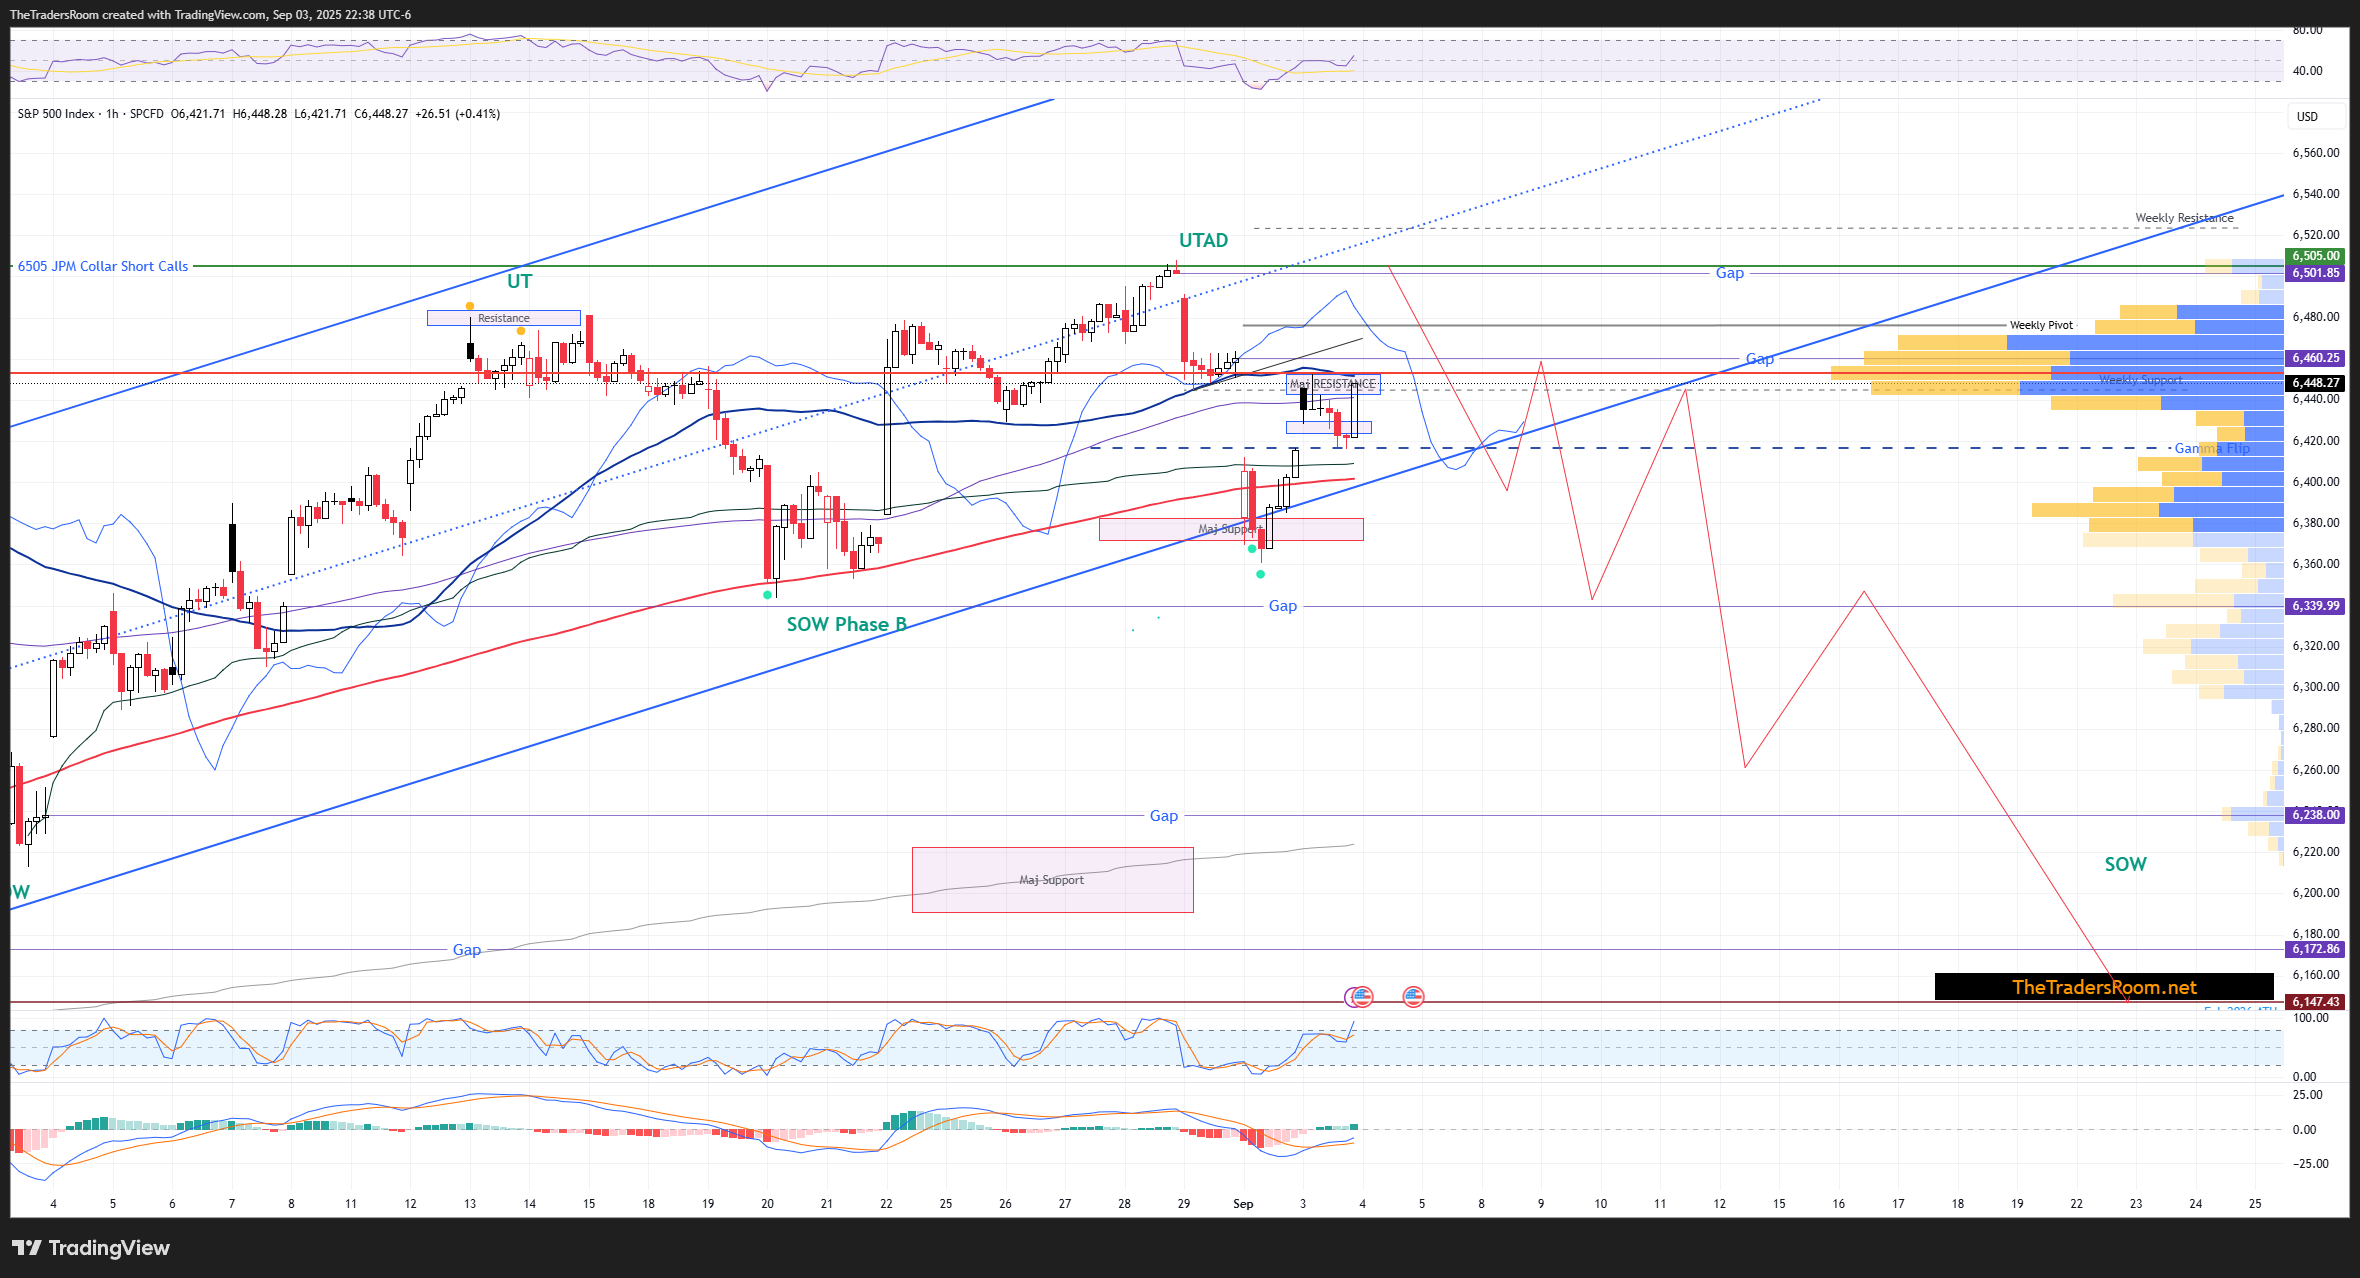
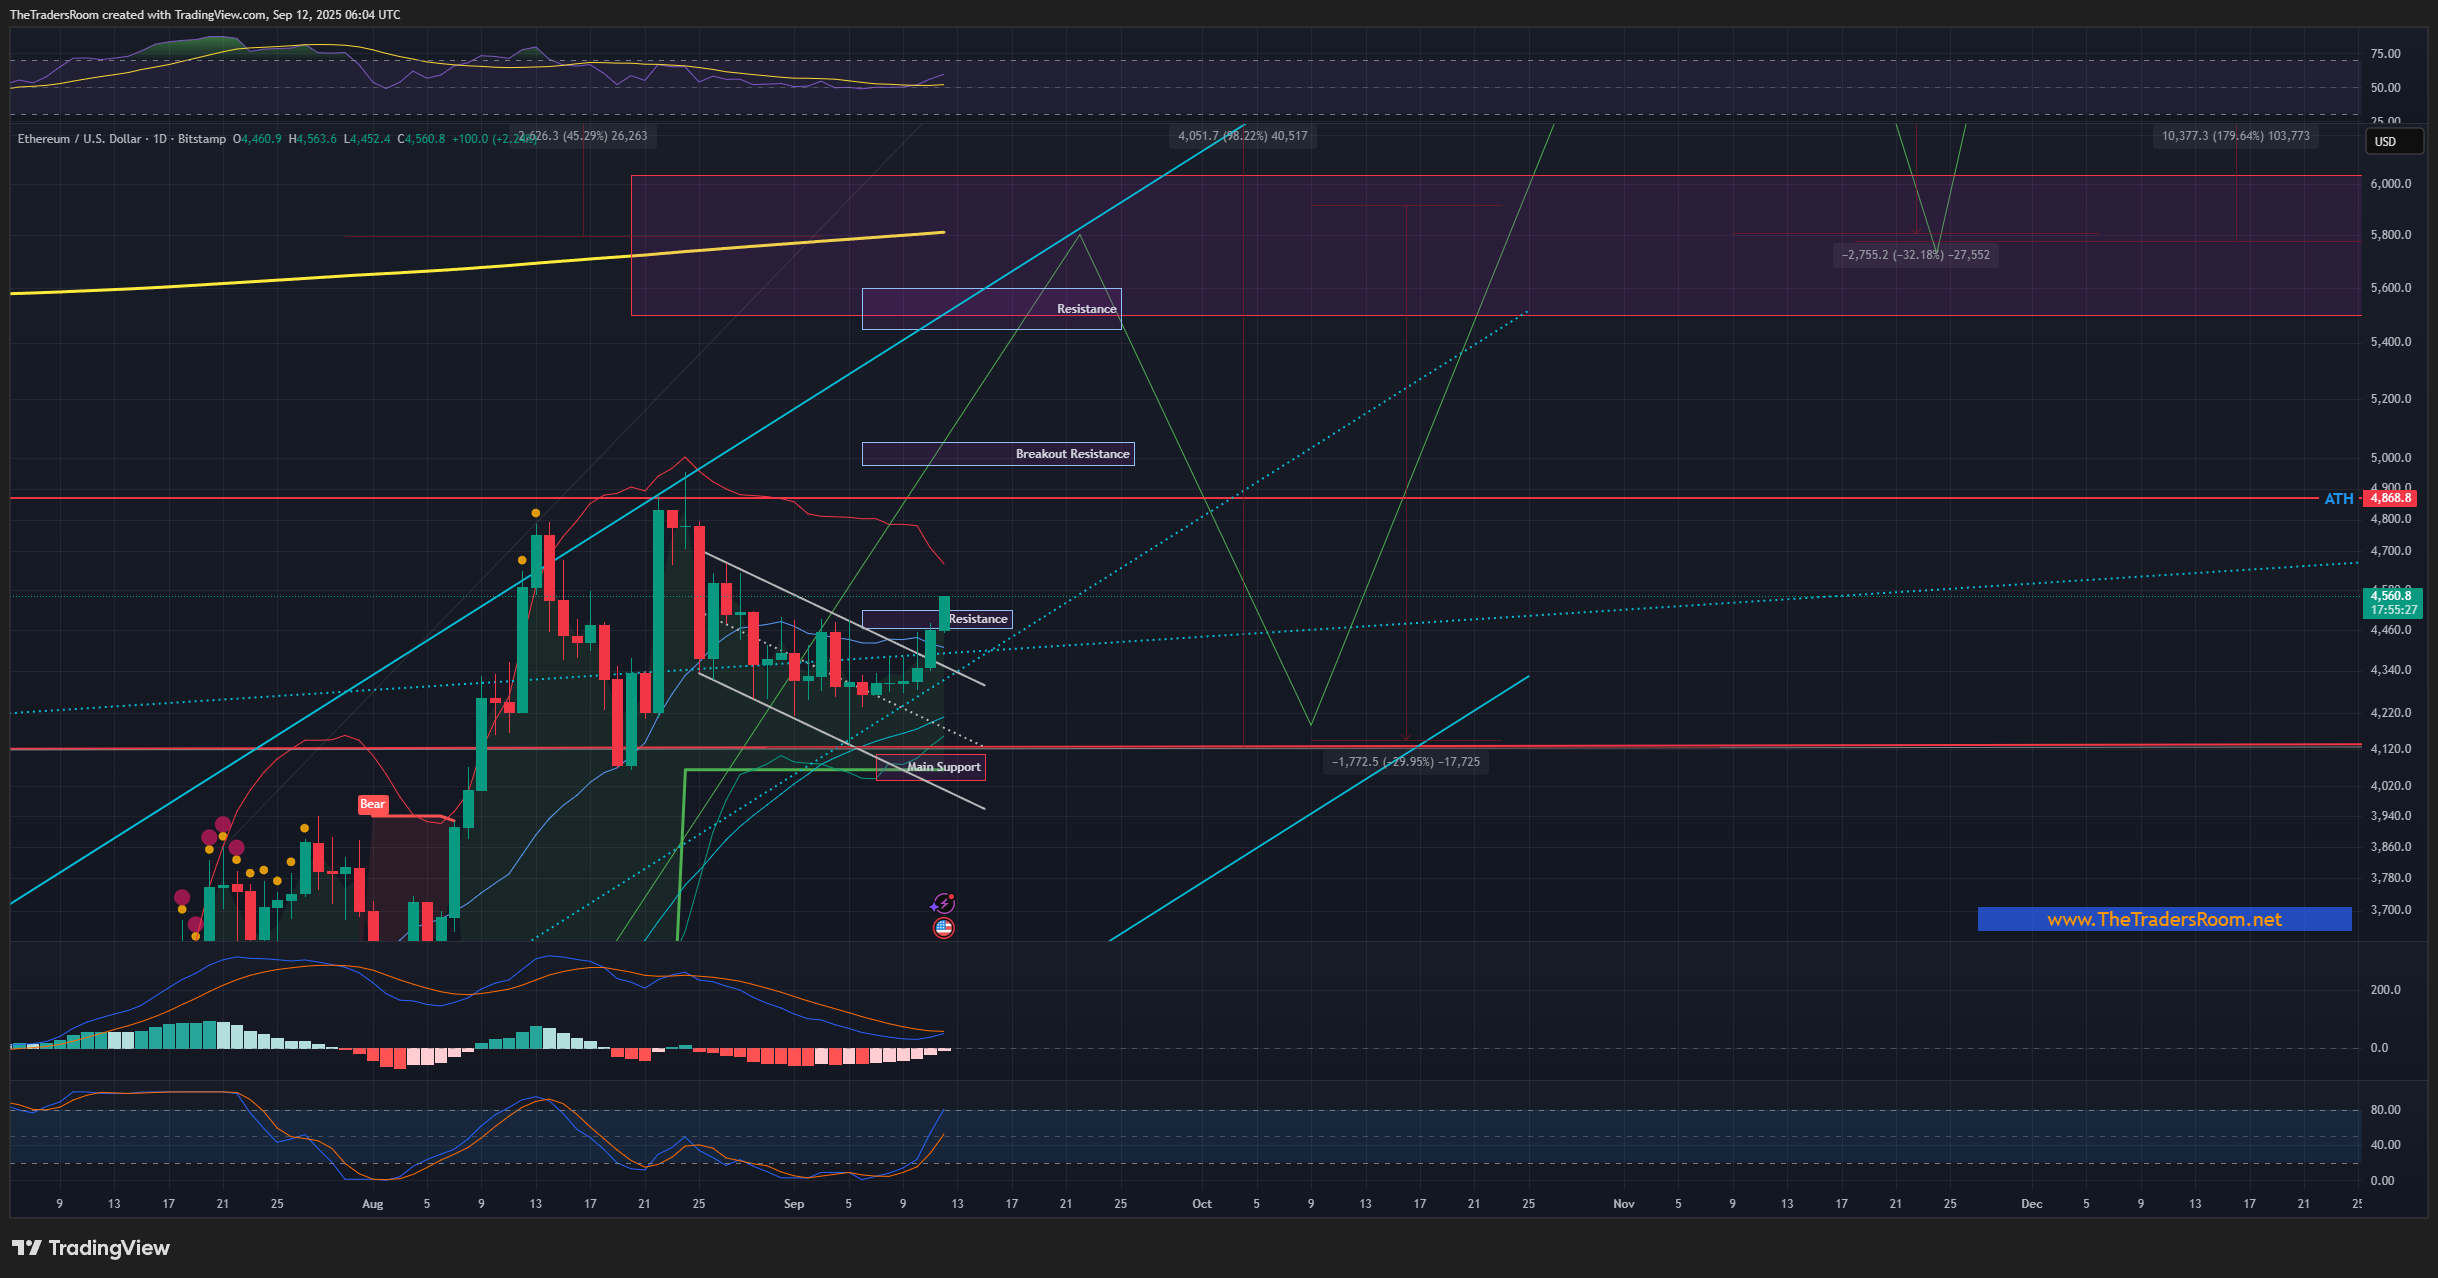
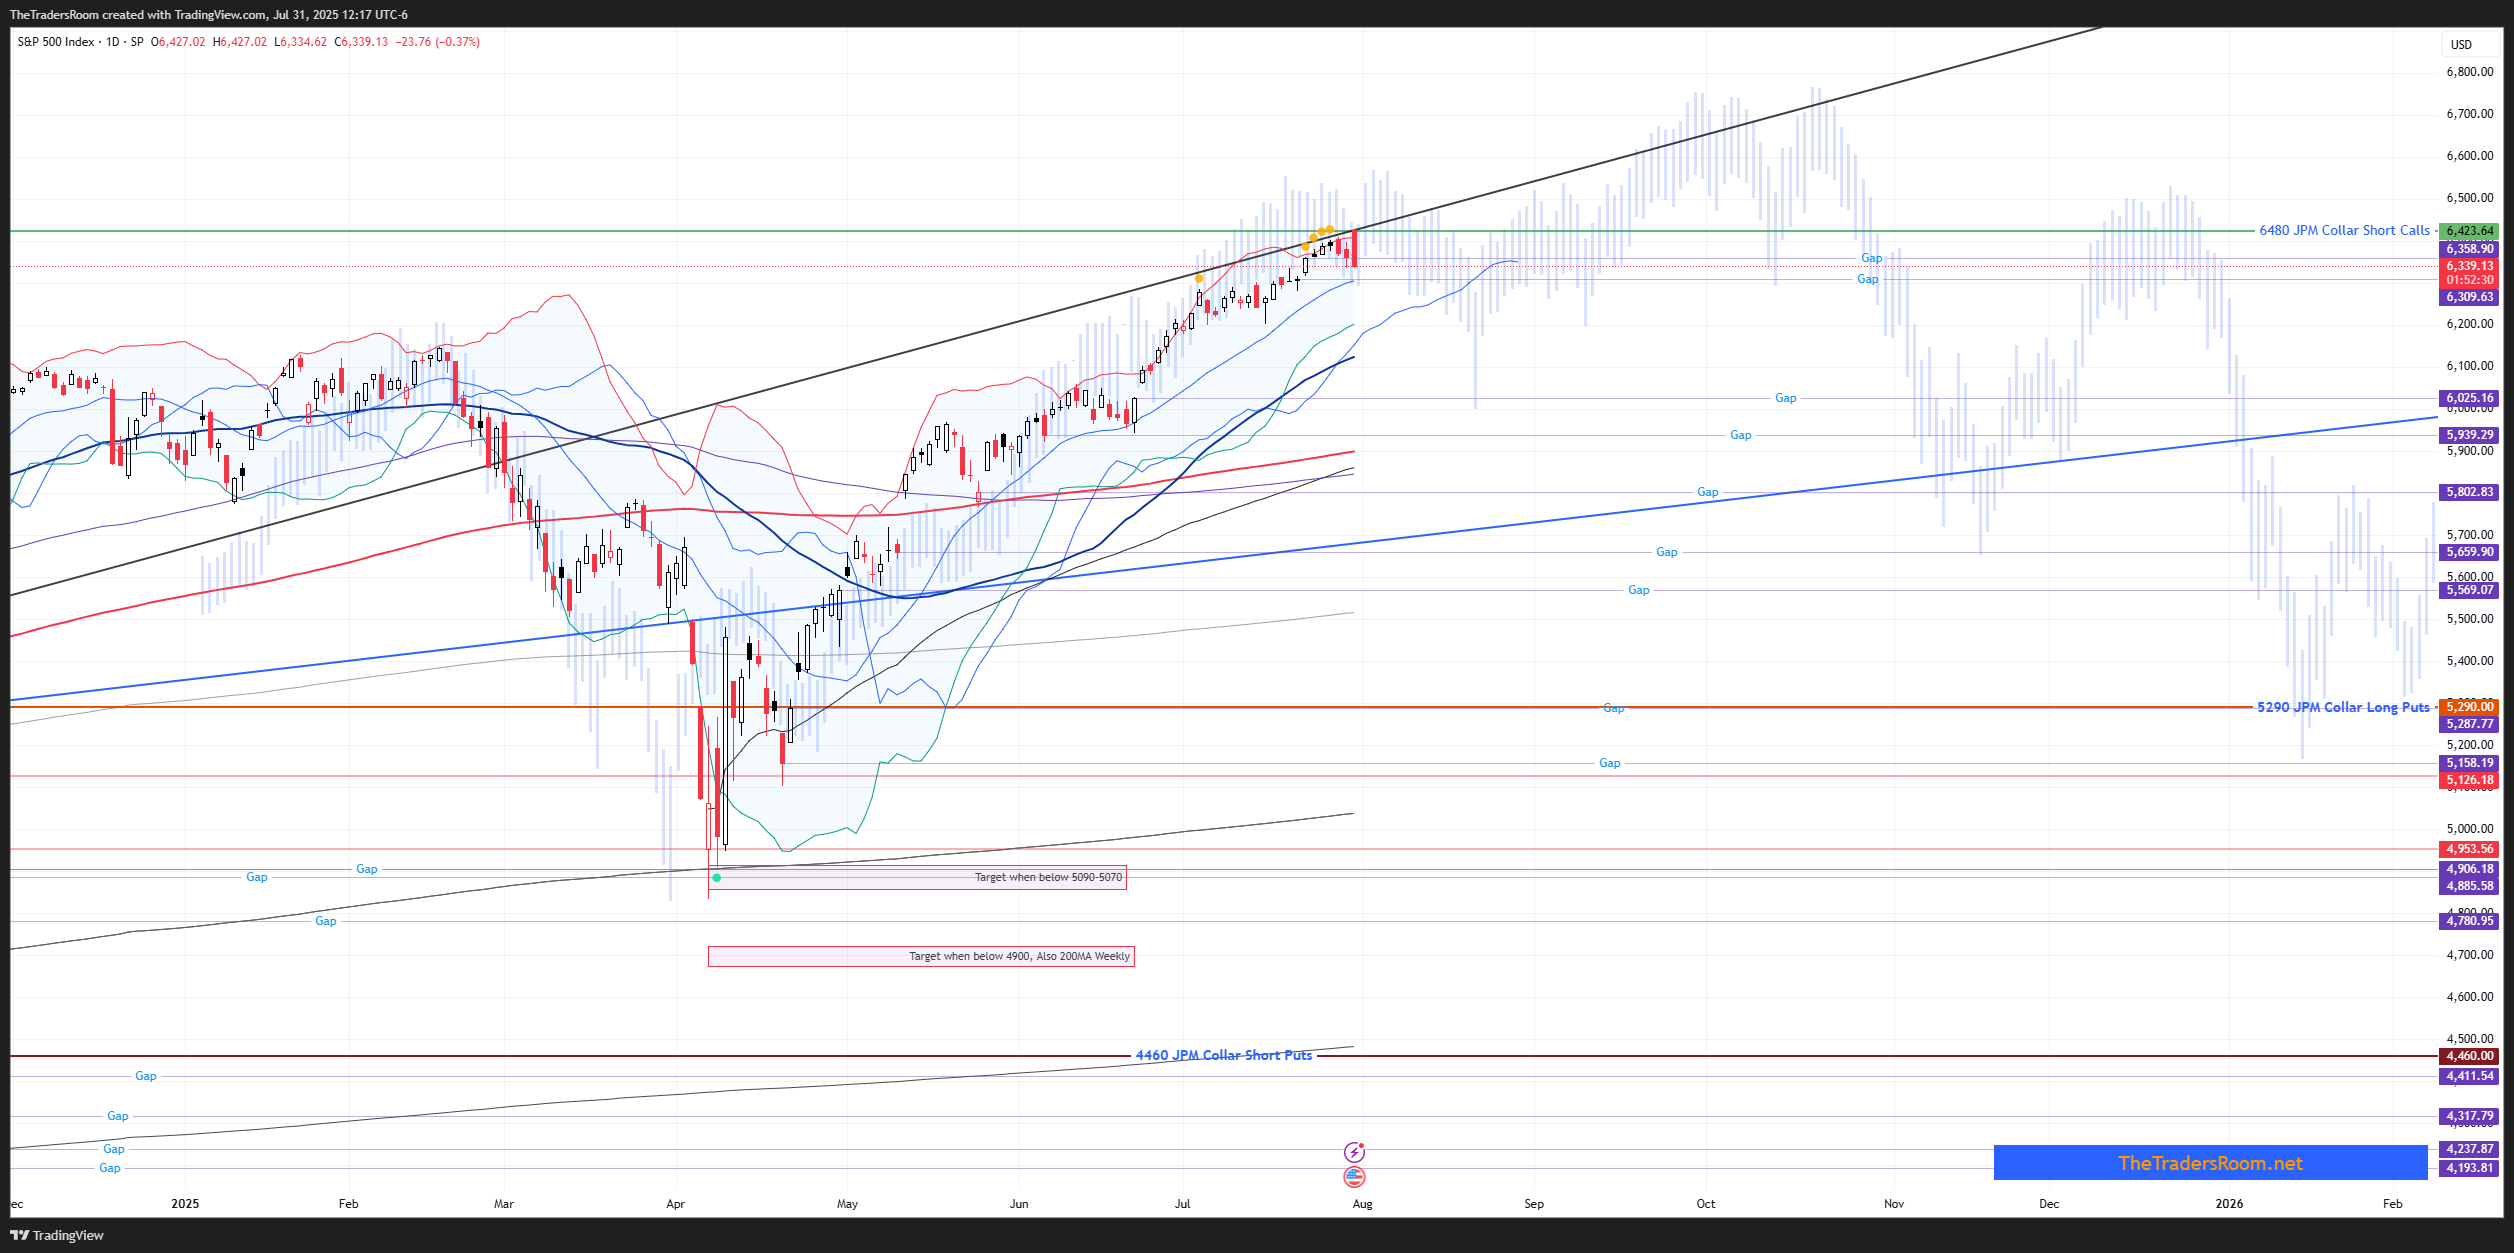
    1. Start with the big picture (4-hour chart)


    Look at a 4-hour chart to figure out the main trend (is price mostly going up, down, or sideways?).


    If it’s going up, you’re mainly looking for buying opportunities.


    Example: If the market has been climbing for days, you want to buy during temporary drops.


    2. Zoom in a bit (30-minute chart) to find a good setup


    Wait for a small dip (a “pullback”) in the bigger trend.


    Ideally, that dip happens in a “demand zone” - an area where buyers have previously stepped in and pushed prices up.


    3. Zoom in even more (5-minute chart) to time your entry


    Look for signs the dip is ending: price stops making lower lows and starts making higher highs.


    This means buyers might be taking control again.


    4. Double-check with “Order Flow” tools


    Use special charts (Bookmap, footprint charts) to see the actual buying and selling pressure.


    Look for:


    Absorption: Big buy orders keep the price steady, even when sellers try to push it down.


    Exhaustion: Selling is drying up, meaning sellers are running out of steam.


    5. Enter the trade


    Buy when both the chart pattern and the order flow signs match up.


    Place a stop loss just below the most recent low to protect yourself if you’re wrong.


    6. Set your target & manage the trade. Aim for a logical price target, like the VWAP (average price of the day) or a known resistance level.


    If the trend continues strongly, consider moving your stop loss up to lock in profits (“trailing stop”).


    In short:


    Start wide, spot the trend → look for a pullback → wait for signs it’s ending → confirm with buy/sell pressure data → buy → set a safe stop loss → aim for a realistic target and protect profits as the trend continues.


    You can scale this strategy on any timeframe 1h, 1D etc. I find a four-hour timeframe is more suitable for me, and I might even look for a weekly chart too, for any swing to long-term trades.


  • TTR-ADMIN
    TimaT Tima

    ETH - a very strong breakout!


    A question is only one - ATH by the end of the week or by the FOMC?


    Here is a thing, IF we see 5600-5900 by FOMC, then the price might squeeze to 8500 by 19th-21st, then get 30% to 40% correction.

    But if it's just 5900 by 19-21st, then the price will re-test ATH the following week into EOM.


    Im going to trade my pathway


  • TTR-ADMIN
    TimaT Tima

    Hi xplora, Im seeing your messages


  • TTR
    TimaT Tima

    Hi Jeff, thanks for lettig me know, I will update. Im also not updating the list here as the website is still in beta mode. Im keeping track of it in the old TTR.


  • TTR-ADMIN
    TimaT Tima

    So we got our directional change day from the opening high. A reversal from the open is usually a bearish sign, especially after breaking the opening low. So today’s bullish daily cycle bar was about making a high, and we have a bearish daily trading cycle bearish for tomorrow, so I expect a low and a reversal into Aug 5th, from where this move should be done, and we will see a summer correction where Aug 5th high could be a lower high, but I prefer 6445± SPX tested.

    I have an issue with the regular and logarithmic scale charts. You can see the 1965 pattern chart below with the regular chart scale. We hit the top of the rising channel off Oct 2023 low


    When the general Green pathway chart below has that line way up (bolded black line) with a logarithmic setup.


    If the Aug 5th high will be capped at 6445, I will change the Green pathway to regular scale


  • TTR-ADMIN
    TimaT Tima

    ES H&S is still alive. Aove that Daily resistance level it will get invalidated


  • TTR-ADMIN
    TimaT Tima

    YM is flagging. Both MACD and RSI are curving up. It seems we are ready for another squeeze here. I will jump on a trade if it breaks out or down


  • TTR-ADMIN
    TimaT Tima

    First thing you do when you cash out on those Alt Coins:


    • Pay all the debts, to your friends and family, banks, your car loan etc;
    • If enough to cover your mortgage, pay it off;
    • Buy physical silver and gold;
    • Hoard cash and wait for some buying opportunities;
    • Do not reinvest the rest all at once, wait for a good setup;
    • Split your electronic cash between USDT and USDC and stake it in separate exchanges/DeFi places so it will make you $ while you’re waiting for another crypto crash to buy back Good coins, coins that have real utility behind them.


    This is my game plan. I will be very patient during this bull cycle. Im also planning on some trading/rotational trades, but only with the 30% of the capital.


    • I did note about this before - my plan is to move the ETH and BNB gains into rising alt-coins, big caps. There is a chance that I will be able to catch at least another 30% to 2-3x on those, but it has to be a cold and quick to take profits trade. I will be sharing those when we are in legit AltSeason. I will not be trading any meme coins, only utility coins such as HBAR, FET, ADA etc.

  • TTR-ADMIN
    TimaT Tima

    Jul 21th week update


    Gann SPX levels (updated):


    Buy when above 6320.25; Targets (This number used to be a target):


    • 6340.14
    • 6360.06
    • 6380.02

    Sell when below 6280.56; Targets:


    • 6260.77
    • 6221.27
    • 6201.56


    Gann SPY levels:


    Buy when above 631.27; Targets (no change):


    • 637.56
    • 643.89
    • 650.25

    Sell when below 618.77; Targets (no change):


    • 612.56
    • 606.39
    • 600.25
    • 594.14

    SPX Levels of Importance

    Please note - Levels of importance are mostly on the daily closing level! A close above or below resistance or support levels means the next level should be seen!

    So please trade accordingly and use stops! (“Daily” means on the daily closing print)


    The best thing to do is to apply those levels to your chart to keep them visual.

    Here is how to trade these levels
    1. Levels of importance are an early stage in the lifecycle of a reversal level (bearish/bullish) generated from an intraday high or low. Watch the daily/weekly closing above or below the Level of Importance, on the day/week when one of the (bull/bear) levels was tested
    2. Reversal levels enter a not confirmed status until the system determines if the high or low held (usually within a few units (days) of time). So if we have a high of the day, let’s say 6096.35 SPX, and a bullish reversal is at 6091.25, for example. And the day closed below the bullish reversal (6091.25), which is the first stage of a rejection. The second is to ensure that the high (6096.35) on that particular day holds in the following session and the session after. That would be a proper rejection of the bullish reversal.
    3. The same applies to the bearish reversal; the low of the day must hold on the following day.


    SPX Bullish Reversals:


    • 6296.85 Minor Weekly, Extension
    • 6297.88 Major Daily, Extension
    • 6307.10 Minor Weekly, Extension
    • 6308.12 Maj Daily, Extension
    • 6311.57 Minor Daily, Extension
    • 6312.82 Minor Daily, Extension
    • 6338.10 Minor Daily, Extension
    • 6344.06 Minor Weekly, Extension
    • 6400.45 Minor Weekly, Extension
    • 6407.98 Maj Weekly, Extension
    • 6463.63 Minor Monthly, Extension


    SPX Bearish Reversals:


    • 6200 Gamma Flip
    • 6174.80 Minor Daily
    • 6132.20 Minor Daily
    • 6002.20 Minor Daily
    • 5994 Minor Daily, Strong
    • 5971.70 Minor Daily
    • 5921.10 Maj Daily
    • 5843.50 Maj Daily
    • 5830.80 Minor Daily
    • 5829.40 Minor Weekly Strong
    • 5802 Maj Intraday
    • 5767.30 Minor Daily
    • 5578.50 Maj Daily and Minor Weekly
    • 5558.40 Minor Daily Strong
    • 5468.50 Minor Daily
    • 5402.50 Maj Monthly
    • 5011.05 Maj Monthly

  • TTR-ADMIN
    TimaT Tima

    We have a good Island Reversal setup here. The price needs to gap down below 6285 and hold below 6300-6305 SPX on any test on Tuesday am for a sell-off initiation. Setup is there, now it’s up to the night monkeys.

    There is a call wall at 6300 and nothing much below it, especially below 6275 SPX. When the price breaks below 6275 tomorrow, selling will pick up. I will enter with 0DTE SPX puts, but again, IF that level gets broken

    SPX Gamma Flip is at 6172. It was updated on the live charts as well as the support boxes

    SPX_2025-07-21_23-59-112400×1253 437 KB


    SPY for Tuesday trading:

    • I did update all of the levels, including weekly and daily


    If 622 gets hit tomorrow, it will be a perfect long day trade setup IMO. Target is a weekly pivot

    SPY_2025-07-22_00-06-452400×1253 418 KB


    The main date of interest is 24th, so a low on that day is expected.

    My WAG for the EOM is in the header of the weekly thread


  • TTR-ADMIN
    TimaT Tima

    SPX over 20MA stats are not looking good going into the 24th of July; start from day 2, its today, Tuesday

    data1048×1075 103 KB


    More on weekly and monthly data

    data21920×608 108 KB


    Retail is going ballistic with call options

    retailballistic1871×1070 135 KB


    Bullish Percent Index is below 70 now. Expect volatility to rise


    SPX advance decline has closed below its zero line

    GwaGNObXwAAiiXq800×586 62.2 KB


    One of my top/bottom indexes is still on the rise

    XLY_XLP_2025-07-21_20-16-092400×1253 313 KB


    Dollar is down, which is also not bearish for the stock market

    DXY_2025-07-21_20-16-392400×1253 315 KB


    SKEW is back to extreme zone, a place where sell-offs happen

    SKEW_2025-07-21_20-17-132400×1253 458 KB


    PCR is setting up for a squeeze

    PC_2025-07-21_20-18-102400×1253 477 KB


    RSP is retracing without a breakout to ATH. SPX needs a sizable and quick correction so RSP catches up to the price, and then it will be able to breakout on the next move up.


  • TTR-ADMIN
    TimaT Tima

    ES chart test


  • TTR-ADMIN
    TimaT Tima
    MEJT Unprinted Numbers as of Jul 21 2025


    - 6333.40 Jul 21 2025

    - 6285.94 Ultimate Jul 17 2025

    - 6270.48 Jul 17 2025

    - 6132.82 Jun 26 2025

    - 6133.42 Jun 26 optional

    - 5978.08 Jun 20 2025

    - 5916.20 Jun 2 2025

    - 5650.36 Apr 9 2025

    - 5489.50 Apr 30 2025

    - 5414.71 Apr 24 2025 optional

    - 5029.24 Apr 9, 2025 Optional

    - 4744.78 Jan 18 2024

    - 4761.34 Jan 11 2024

    - 4645.13 Dec 13, 2023

    - 4631.95 Dec 12 2023

    - 4592.46 Dec 8th 2023

    - 4542.02 Nov 30 2023

    - 4529.15 Nov 15 2023

    - 4391.70 Nov 10 2023

    - 4376.39 Nov 9th 2023

    - 4308.11 Nov 2, 2023

    - 4174.50 Oct 31 2023

    - 4163.10 Oct 31 2023

    - 4042.27 Mar 30 2023

    - 3941.95 Mar 24 2023

    - 3849.72 Mar 15 2023

    - 3775.69 (DEC 22, 2022)

    - 3200.69 24 JUL 2020


  • Login

  • Login or register to search.
Powered by NodeBB Contributors
  • First post
    Last post
0
  • Home